
Speed of creation reports
Feel the speed of report creation! While the industry average of creating reports is 4 days, with BI you can develop your custom reports 20% faster.
Gartner Magic Quadrant
Explore the power of the end-to-end BI platform listed in Gartner’s Magic Quadrant; 5 consecutive years*. Our BI system tells you what and why happened.
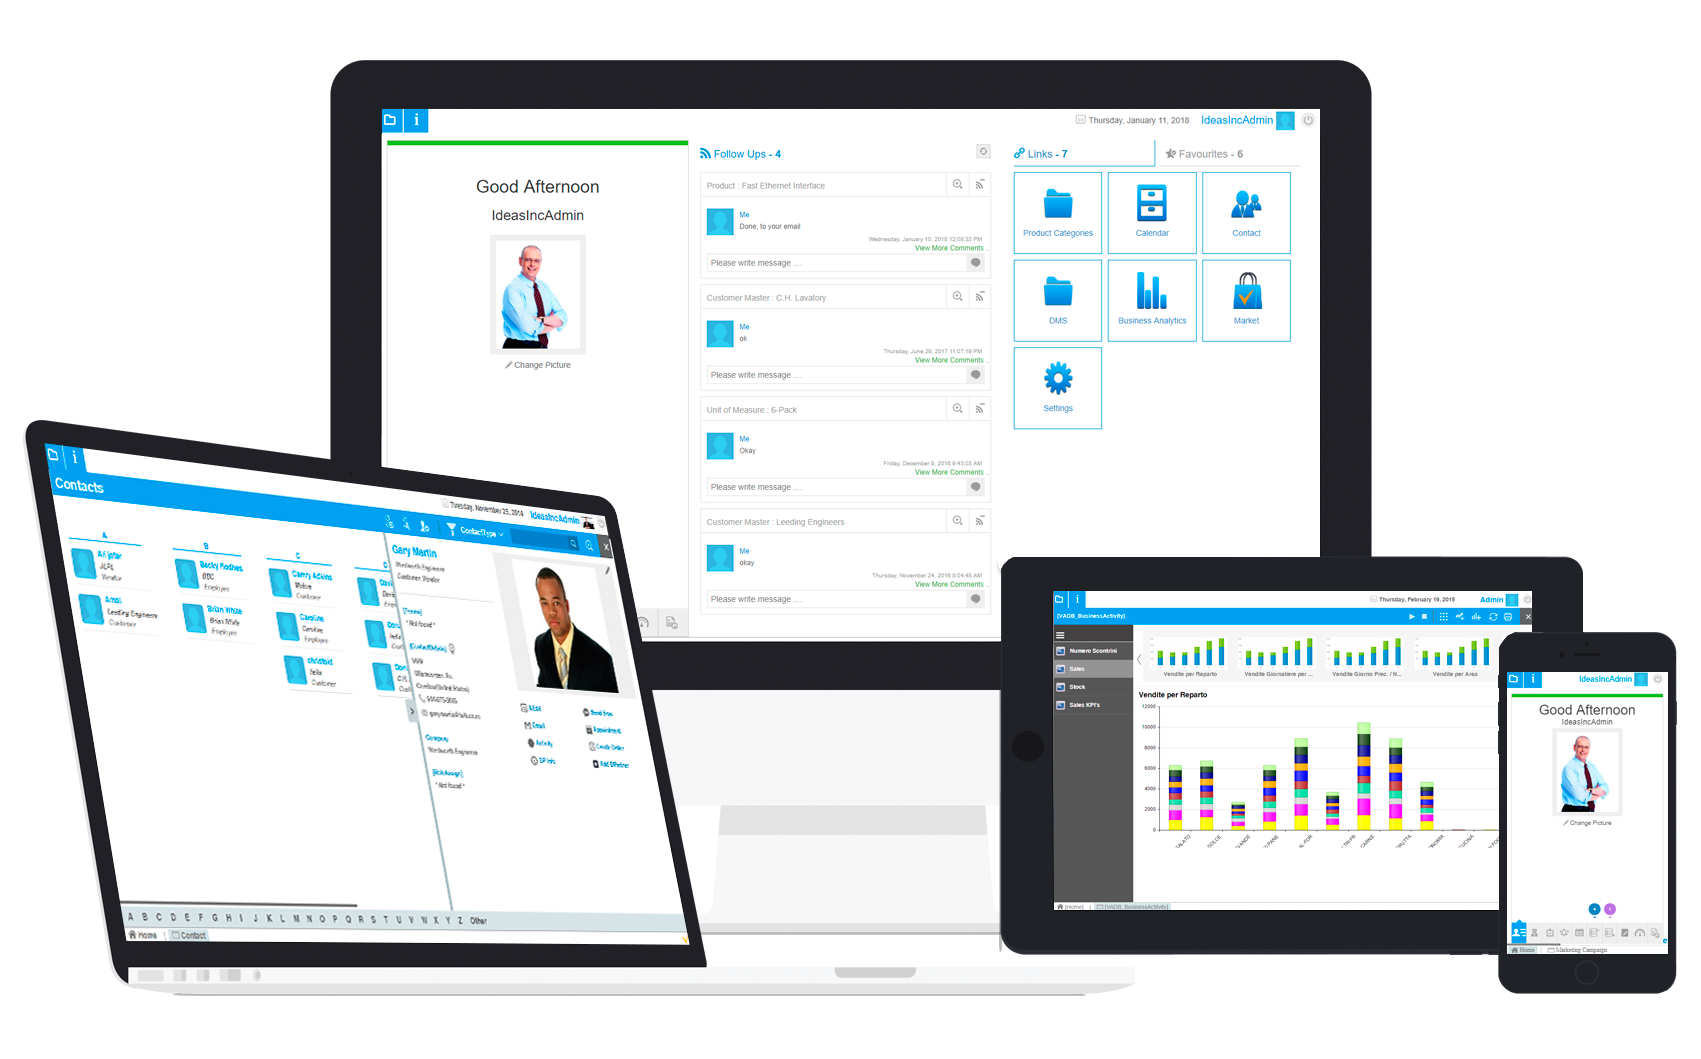
Awesome dashboards
We take you from raw data to great dashboards to actionable insight. Go from data to dashboards in hours – not weeks or months.
Why choose a business intelligence system?
Single-integrated BI platform
It is a web-based BI solution that supports both the analyst and the business user workflows whilst providing the governance IT requires!
The system is deployed on a centralized architecture, with governance baked into the application. In this way we cater to the needs of the 3 stakeholders:
- Business users – consume, share and collaborate on trusted data
- Analysts – create reports and build dashboards
- IT personnel – have complete security and governance over the platform

Business Intelligence is easy!
BI is different. We make it easy for everyone in your organization to analyze, share, collaborate and make data-driven decisions. Unlike most Business Intelligence (BI) software solutions, which fail to meet the needs of the business user, we deliver all the BI functionality you need via a single-integrated BI platform. In this way, business users enjoy the support and freedom needed to make great decisions.BI solution will help you transform your data into rich visualizations and interactive dashboards. This will give you answer to some of the most important questions in your organization.
Innovate with foresight
Use AI and machine learning to tackle complex business problems. Use those insights to optimize your business and deliver actionable insights to your stakeholders.
 by
by